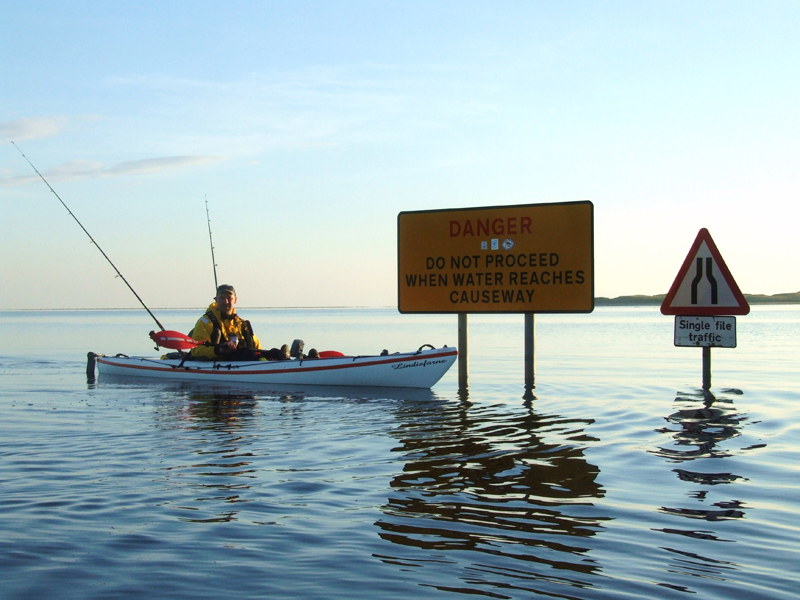
Understanding tides is critical if putting to sea in a kayak. Neil Turnball explains what essential publications kayakers need to make sense of tides before giving a thought to getting wet.
After your first few trips on your kayak you’ll soon learn that the sea is not just a big stagnant pond that gets a bit bumpy on top every now and again. The obvious rise and fall of the tide can be seen standing on the shore, but is that all that’s happening out there? In this feature we’ll try and uncover some of the basic principles of tidal movement and more importantly how you can start to use nature’s free conveyor-belt to your advantage.

When planning a trip there’s numerous factors that we have to take into account, none more so than the obvious hurdle of the weather. But there is one factor that should never be overlooked but very often is… and that is tidal flow.
Lets re-familiarise ourselves with a few basic principles. Tidal movement is the result of gravitational pull, primarily from the moon but the Sun also lends a helping hand. With a couple of exceptions here in the UK we have what is known as a semi diurnal tide pattern. In short, this means we have two low tides and two high tides in a 24-hour period. The rise and fall of these tides (flood and ebb), are what causes the horizontal movement of water that we refer to as tidal streams.
It’s these tidal streams that kayakers are interested in, both in their magnitude (measured in knots), and their direction of travel (referred to as set and measured in degrees)
Take notice of tides
Pick up a set of tide tables and you will see that the tidal range for your area changes dramatically in the course of a month. The peaks and troughs within this range are known as ‘spring’ and ‘neap’ tides. Spring tides give us our largest tidal range between Low and High water and occur when the Moon and the Sun’s gravitational pull are combined. Springs occur roughly every 15 days, first with the new moon and again when there is a full moon.
Neap tides are exactly the opposite of springs. These have a much smaller range and occur when the moon and sun form a right angle to the earth. The gravitational pull is reduced as they negate the other’s influence. This can be seen at the first and last quarters of the moon, again roughly every 15 days.
So why does all this tide mumbo jumbo affect us as kayakers? After all, the rise and fall of the tide on the beach can’t have a huge effect on us when we’re fishing 2km offshore… or can it?
It’s not so much the rise and fall that directly affect us, rather it is the horizontal flow of water created by cyclic rise and fall that’s interesting anglers afloat. The larger tidal ranges (springs) can create twice as much tidal flow as the smaller ranges (neaps). In essence the difference between the two could mean making headway against the tide, or having your exertions count for nothing as you are dangerously pushed in the opposite direction against your efforts.

Let’s look at a simple scenario. For this example we will assume our average paddling speed is 3 knots. A headland exists that we need to paddle around, but unfortunately for us, it would be against the tide. The tidal flow at its peak today is 1.5 knots, and we are paddling on a neap tide. This would present us with a challenging paddle; progress would be very slow, but we would be able to make steady headway.
Now let’s return to the same venue a week later, this time on a spring tide. Our headland could now have flows of up to 3 knots, with a little breeze in the opposite direction that’s enough tide run to create over-falls. It no longer presents us with an arduous, arm aching paddle, our passage has now degraded into a near impossibility, and a very dangerous prospect. With this in mind we now have good reason to understand the nature of the tides and the basic principles of tidal streams.

To help us make tidal predictions and local stream calculations there’s few pieces of handy literature out there that can make life a bit easier, starting with a set of tide tables.
Local Tide Tables
A simple table of tides times for your local waters is a must-have essential item. You can easily get a tidal overview for the whole year showing daily times and heights of High and Low water. Handy for planning kayaking trips and bait collection in advance. You can even find these free online for the full year..
Admiralty Tidal Stream Atlas
Available for all areas of the UK, the atlas shows 13 charts of tidal streams each at an hourly interval. These start 6 hours before HW, and show the changing speed and direction of the tidal stream right through to 6 hours after HW.
Each page indicates the speed and direction of flow for that given period of time for both spring and neap tides. A computation of rates table is also provided for you to calculate the stream rate on the intermediate tides.
The atlas is another essential publication, especially if you want to find out more about the tidal streams on your patch. One word of warning though, the atlas is geared towards commercial activities, so it tends to base its calculations on main shipping channels and routes. Because of this the atlas doesn’t take into account local anomalies. Bays that can create reverse eddies, and headlands that might create stronger rips may be absent form such charts.

Admiralty Chart
Apart from the obvious navigational benefits of a chart there’s a small tidal stream table that’s often overlooked. Each chart will have small strategically placed coloured diamonds. These all contain a letter, and at the bottom of the chart a tidal stream table containing/explaining these letters is found. Some vital information can be gleaned from these.
For the charted position of the diamond, the table will show the tidal stream’s direction of travel (measured in degrees), and the average tidal stream rate, both at spring and neap tides. All this is shown over a 13-hour period, which takes in the full cycle of the tide. Again these diamonds are placed in areas of interest for shipping. The stream information on the chart is more accurate than the atlas, but like the stream atlas, remember to allow for local anomalies.
That’s really all the publications we are interested in at this time. There are lots more out there, such as Almanacs and Pilots books, but for our short trip planning the few mentioned above will suffice.

Information on tap
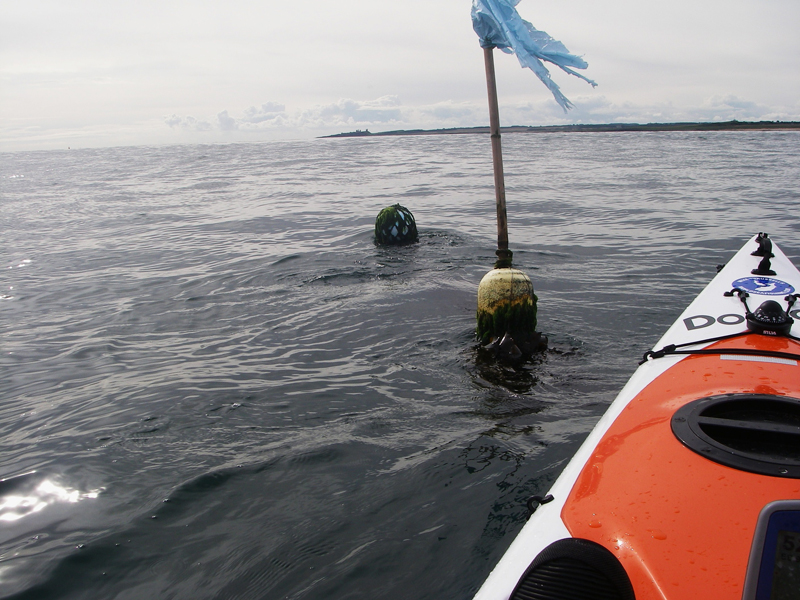
Tapping into hard won local knowledge is a priceless shortcut to information. Keep in with the local commercial boats, particularly crab and lobster fishing boats who need knowledge of the tides to find their bouys, or your friendly charter skipper. A few pints shoved over the bar in their direction will gain you more local information than you’ll pick up in any book.
Let’s take a closer look at the stream atlas. The first thing you will see is that the rate and direction of tidal flow differs throughout the duration of the tide cycle. There’s always a slack period – not necessarily over h
igh and low water – and then there is a gradual increase in flow rate, before it peaks and then decreases before slack water.
50/90 Rule
The 50/90 rule is a simple calculation that you can use to roughly calculate the speed of this flow at the end of each hour throughout the tide. To do this refer to your tidal stream atlas or your chart, and find out when slack water occurs. Once you have that information it’s easy.
By the end of the first hour after slack water, the tide will be flowing at 50% of its potential rate for that day, and by the end of the second hour it would be travelling at 90%, while at the end of the third hour it would have reached it’s maximum flow of 100%. The end of the fourth hour sees a reduction back to 90%, and the fifth would decrease further to 50%, putting you back on slack by the sixth hour at which time it would change direction and start all over again.
Using the 50/90 formula all we need to know is the maximum flow rate of the tide on that day, and then we can start to make more accurate predictions, possibly saving some energy by proper planning and letting the tide do some of the work.
In the next instalment we’ll try and put some of this information into practice, and take a look at the basic principles of planning a simple kayak trip.